 my
myThe Latest Construction Industry Statistics (Updated February 2024)
Table of Contents
- Construction Market Statistics
- House Building Statistics
- Construction Safety Statistics
- Cement and Concrete: Sustainability Statistics
- Construction Industry Employment Statistics
- Mental Health in Construction
- US Construction Statistics
- Demolition Industry Statistics
- What are the Largest Construction Groups in the World?
- New Home Developments
- Sources
Headline Construction Statistics for 2023:
- The total construction output for the UK in Q3 2023 is £46.684 billion.
- The value of global construction work in 2022 totalled $9.7 trillion.
- 56% of the world’s population lives in cities.
- Energy demand in buildings increased by 4% compared to 2021 - the largest increase in 10 years.
- Buildings currently account for 39% of global energy-related carbon emissions. 1.2 million km² will be added to built-up urban areas by 2030.
- In 2021, there were around 2.3 billion homes globally.
- The global buildings and construction sector isn’t on track to decarbonise by 2050.
- Net Zero Scenarios see energy use in buildings drop by 25% compared to today.
- Over the next 15 years, the 4 fastest-growing construction markets will be the Philippines, Vietnam, Malaysia and Indonesia.
- The value of global construction in 2037 is estimated at $13.9 trillion.
The total construction output for the UK in Q3 2023 is £46.684 billion (seasonally adjusted). This represents a quarterly increase of 0.1% compared to Q2 2023, and is the 8th consecutive quarter of growth.
Construction Market Statistics
Is the construction industry growing or declining?
Construction output in the UK increased by 0.1% in Q3 2023 compared to Q2 - this growth came solely from growth in September after consecutive months of falls. This is the 8th consecutive quarter of growth in construction. However, new work saw a decrease of 0.3% in Q3 2023.
Globally, the construction industry is growing - the next 15 years will add an estimated $4.2 trillion in value to construction work.
How many houses are there in the world?
2.3 billion houses.
While it’s impossible to get an exact figure for the number of houses worldwide, there were estimated to be 2.3 billion homes in 2021. ‘Homes’ here means any dwelling in which people live, including apartment blocks. This excludes buildings for collective living (hotels, lodging houses, institutions etc.).
What are the top construction markets in the world?
Asia-Pacific was the largest construction market in the world in 2022, accounting for 40.8% of the market. This was followed by North America and Western Europe.
The top construction markets in the world are:
- China
- The US
- India
- Indonesia
- The UK
What country has the most construction going on?
China is the country that has the most construction going on.
Over 1175 infrastructure projects valued over $25 million were in development or execution in China as of May 2022, making the country the most active construction market in the world.
China, the US and India will account for 57% of growth in the construction market by 2030. These countries will collectively add $4.5 trillion in value to the global market.
Other countries are increasing their rates of construction. For instance, Nigeria is predicted to expand its construction market by 160% by 2030 as it becomes the world’s 5th most populous country.
Construction activity has largely returned to pre-Covid levels in major economies. The 2020 construction market size was $6.4 trillion. By the end of 2023, the market size is predicted at $8.9 trillion, rising to $14.4 trillion by 2030.
- By 2030, the global construction market size is estimated to be worth more than twice as much as it was in 2020 ($14.4 trillion vs. $6.4 trillion).
- The number of built-up areas (defined in the literature as ‘areas with lots of buildings’, or urban areas) globally increased from 794,432 in 2016 to an estimated 849,407 in 2022.
- 70% of construction work carried out over the next 15 years will occur in the world’s top 10 construction markets.
- Indonesia spent an estimated $68 billion on infrastructure projects between 2016-2019, establishing the country as a leading construction market.
- Global building stock is expected to double towards the middle of the 21st Century.
- The 30 largest global construction groups saw aggregate market capitalisation grow by 10.8% in 2022.
- In addition, net income increased by 21%, with revenues increasing by 16%. However, revenue gained from international sales dropped to 15% - down from 19% in 2019.
- The total revenue of the top 100 largest construction groups increased by 6.3% in 2022 compared to 2021, to a total of $1.9 trillion.
House Building Statistics
Are there enough homes being built in the UK?
The new housing supply is currently below the UK Government’s target of 300,000 new homes every year. 178,000 new homes were built in England in 2022.
The UK has a shortfall of 4.3 million houses compared to the average European country. Based on the Government’s current target of 300,000 new homes every year, filling this backlog would take at least half a century. 654,000 homes would need to be built every year for the next decade to solve the problem in England alone.
How many homes in the UK are empty?
Currently, over 1 million homes in the UK are empty.
This includes 250,000 homes in England that have been empty for more than 6 months and 257,000 second homes.
Which country has the largest homes?
Australia ranks highest for home size, with an average of 2032 square feet, closely followed by the US (1900 sq. ft.) and Canada (1700 sq. ft.). The 5 countries with the largest average house size are:
- Australia - 2032 sq. ft.
- US - 1900 sq. ft.
- Canada - 1700 sq. ft.
- UK - 1590 sq. ft.
- France - 1550 sq. ft.
How many houses have been built since 2010?
Between 2010 and 2020, 1.3 million houses were built in the UK. These were primarily built by private developers; housebuilding by local authorities has declined sharply over the last few decades.
How much has social housing stock decreased in England?
There has been a net loss of 165,022 social homes over the last 10 years. This is despite 1,206,376 households in England being on social housing waiting lists in 2022, an increase of 5% since 2020.
In total, England’s social housing stock has decreased by 1.4 million since 1980. Since 1991, England has lost an average of 24,000 social homes every year - and that’s accounting for social homes built during the period.
- Since 2000, the most active quarter for new housing completions was Q1 2021, with 48,670 completions. The least active quarter was Q1 2013, with 25,150 completions.
- The most active quarter for new housing starts was Q2 2023, with 67,600 starts.
- The least active quarter was Q2 2020, with 16,650 starts.
- Since 2020, housing starts in England have averaged 36,885 per quarter. Housing completions have averaged 36,199 per quarter.
- Additional housing supply in England reached 234,400 for the period 2022-23. This includes 212,570 new build homes.
- Net additional dwellings in England peaked at 248,590 in 2019-20.
- Building a standard-quality house in the UK costs somewhere between £1200-£1500 per square metre. Higher-quality homes with custom design work could cost £2500 or more per square metre.
- The average cost of building a house in the UK is around £150,000-£200,000 - for a 3-4 bedroom property.
- More than half of local authorities in the UK didn’t build any council homes during 2022.
- Local councils built just 4230 homes in 2022.
Number of Dwellings Completed in England 2000-2022
| Year | Private Enterprise | Housing Associations | Local Authorities | All Dwellings |
|---|---|---|---|---|
| 2000 | 118,460 | 16,740 | 100 | 135,300 |
| 2001 | 114,880 | 14,470 | 170 | 129,520 |
| 2002 | 123,010 | 13,320 | 170 | 136,500 |
| 2003 | 130,610 | 12,880 | 180 | 143,670 |
| 2004 | 137,070 | 16,570 | 140 | 153,780 |
| 2005 | 141,330 | 17,610 | 180 | 159,120 |
| 2006 | 140,370 | 20,800 | 290 | 161,460 |
| 2007 | 154,940 | 22,110 | 250 | 177,300 |
| 2008 | 121,940 | 26,550 | 430 | 148,920 |
| 2009 | 98,000 | 27,360 | 360 | 125,720 |
| 2010 | 83,550 | 22,610 | 790 | 106,950 |
| 2011 | 85,400 | 25,620 | 2230 | 113,250 |
| 2012 | 88,810 | 25,000 | 1410 | 115,220 |
| 2013 | 86,800 | 21,590 | 840 | 109,230 |
| 2014 | 92,690 | 23,750 | 1180 | 117,620 |
| 2015 | 110,340 | 29,970 | 1660 | 141,970 |
| 2016 | 115,400 | 24,320 | 2110 | 141,830 |
| 2017 | 133,130 | 27,220 | 1750 | 162,100 |
| 2018 | 134,700 | 27,500 | 2680 | 164,880 |
| 2019 | 143,880 | 31,870 | 2190 | 177,940 |
| 2020 | 120,480 | 25,510 | 1270 | 147,260 |
| 2021 | 142,960 | 31,350 | 1590 | 175,900 |
| 2022 | 144,530 | 31,840 | 1620 | 177,990 |
Construction Safety Statistics
How many fatal accidents occur each year on construction sites around the world?
At least 60,000 fatal accidents occur each year on construction sites around the world. This means that a construction worker dies every 10 minutes due to accidents at work.
What are the statistics for construction accidents?
The fatal injury rate in construction increased to 2.10 for 2022/23, compared to an average of 1.72 between 2018 and 2022. The fatal injury rate measures the number of fatalities per 100,000 workers. This translates to 45 deaths in construction for 2022/23, more than double the next most dangerous industry agriculture, forestry and fishing (21 deaths).
In the UK, an average of 59,000 construction workers suffered a non-fatal injury each year from 2019–2022.
Of 135 people killed at work in 2022/23, 45 worked in construction.
What is the largest cause of construction accidents?
Falls are the largest cause of construction accidents. ‘Falls’ can be split into 2 categories - falls from a height and falls on the same level (also called ‘slips and trips’).
In the UK, slips, trips, and falls account for over a quarter (26%) of construction workplace injuries.
What is the accident rate in the construction industry?
The fatal injury rate (the number of injuries per 100,000 workers) in construction in the UK has hit 2.10 in 2022/23, increasing from an average of 1.72 between 2018 and 2022.
More than a fifth of all fatal work accidents in the EU were within construction.
In the UK, an average of 37 workers have died each year between 2018-2023. In 2022/23, 45 construction workers were killed, more than double the next-most dangerous industry, agriculture, forestry and fishing (21 deaths).
For 2021/22, 61,713 workplace injuries were reported in the UK. Of these, 4185 occurred within the construction industry, with the most common injuries being slip, trips, and falls (1041 injuries).
Safety in construction is an enduring issue. Industrialised nations usually have strict regulations and procedures governing safety on construction sites. However, those protections are often absent in developing countries, contributing to relatively high rates of workplace accidents and deaths.
- Across all industries, an estimated 2.3 million people are killed at work every year.
- In industrialised countries, the construction industry accounts for between 25%–40% of work-related deaths.
- 60,000 fatal accidents occur on construction sites each year.
- In 2019 in the US, 1061 construction workers died while at work - they accounted for more than a fifth (20.7%) of workplace deaths in the country that year.
- The construction industry accounts for around 15% of US worker compensation costs.
- Over 1000 construction workers are killed and 800,000 injured every year in Europe.
- 75% of the health problems experienced by European construction workers are musculoskeletal. The most common complaints are in the back and lower extremities.
Injuries and Fatalities in the Construction Industry (Latest Available Figures)
| Injury Type | UK (2022-23) | USA (2021) |
|---|---|---|
| Slips, Trips and Falls on the Same Level | 13,780 | 132,000 |
| Electrocution | 370 | 4900 |
| Struck-By (Vehicles, Objects and Equipment) | 6360 | 167,300 |
| Falls From a Height | 10,600 | 109,200 |
| Fatalities | 45 | 10,625 |
Cement and Concrete: Sustainability Statistics
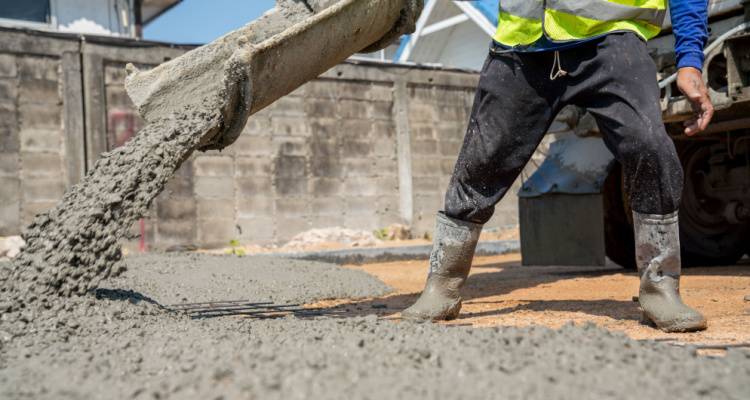
Does cement contribute to global warming?
Cement does contribute to global warming. It’s used in concrete, the second-most used material on Earth (after water), and is used in our roads, dams, bridges and buildings. However, the industry is responsible for around 8% of CO2 emissions.
Can concrete be recycled?
Concrete can be recycled. It can also be made from recycled materials, and pieces from demolished buildings or structures can be reused for purposes like shoreline protection.
Is concrete worse for the environment than steel?
Both steel and concrete are crucial materials in construction, but they both release huge amounts of carbon during production and use. The carbon footprint of steel is around 1.4 tons per ton of steel produced; the carbon footprint of concrete is around 0.93 tons for every ton of concrete produced.
What is the carbon footprint of concrete?
The carbon footprint of concrete is around 0.93 tons for every ton of concrete produced.
After water, concrete is the most consumed product on the planet.
- Concrete is responsible for over 4 billion tonnes of carbon dioxide pollution each year.
- Concrete production is the cause of 8% of global CO2 emissions.
- Each pound of concrete produced leads to 0.93 pounds of carbon dioxide.
- Cement production alone creates around 2.5 billion tonnes of CO2 emissions every year.
- Concrete uses almost 10% of global industrial water supplies.
- The cement industry produces more than 8 billion tons of cement every two years - for comparison, around 8 billion tons of plastic have been created over the last 60 years.
Construction Industry Employment Statistics

How many construction workers are there in the world?
There are around 220 million construction workers in the world.
How many people work in construction around the world?
The number of people working in construction around the world is currently estimated at 220 million. This number has fallen since 2014, when around 273 million worked in the industry.
The UK construction industry employs 2.69 million people (as of the start of 2022).
The US construction industry employs around 7.9 million people (as of May 2023).
What percentage of people work in construction?
Around 9% of working-age people work in construction.
The percentage of people working in construction in the UK was over 9% of the total workforce, equating to 3.1 million workers in 2018, which has since dropped to around 2.69 million in 2022. Globally, construction accounts for around 8.6% of the total workforce.
Is there a shortage of construction workers in the UK?
Vacancies in the UK construction industry are around 65% higher than pre-pandemic levels.
Several construction-related roles, including bricklayers, masons, and roofers, are currently listed on the UK’s shortage occupation list.
This lists jobs that are in high demand in the country but have a lack of skilled workers who are citizens or residents. The list makes it easier for employers to recruit from overseas for specific roles, with relaxed eligibility criteria for sponsored visas.
How many construction workers does the UK need?
It’s estimated that the UK needed to hire 158,000 workers to fill the current demand for construction - demand is expected to increase over the next few years. Around 225,000 additional workers may be needed to fill that demand.
An additional estimated 225,000 construction workers may be required by 2027 in the UK to fill demand.
- The construction industry employs millions - in 2018, the global workforce stood at more than 111 million, with an average increase of 1.3% each year.
- In 2014, construction, demolition, renovation and maintenance of buildings and civil engineering projects employed 8.6% of the global workforce - equating to 273 million full-time and part-time jobs.
- 225,000 additional workers may be required by 2027 in the UK to meet construction demand.
- Around 40% of construction workers in the US are aged 45-64 - older workers are more susceptible to certain injuries.
- The percentage of the US construction workforce aged 55 and over increased from 17% in 2011 to 22% in 2018.There were 358,000 unfilled jobs in construction in 2021 - this shortage is expected to get worse, with the workforce predicted to become older and less experienced.
- 44.5% of injury claims in construction come from workers with less than a year’s experience on the job - 30.1% of claims are made by workers with less than 6 months experience.
Mental Health in Construction

How many construction workers suffer from mental health issues?
83% of construction workers in the US suffer from mental health issues.
Rates of mental health issues among construction workers are high across the globe. In the UK, 97% of construction workers feel stressed at work.
64% of Canadian construction workers wish their employers would do more to support mental health. A study of South Asian migrant workers found that 60% awaiting outstanding claims suffered from mental illnesses.
How does construction affect mental health?
Construction can affect mental health as the physical demands of the job increase stress and anxiety, in turn causing decreased productivity, lowered quality of life and an increased risk of long-term absence due to mental illness. The most common impacts are:
Stress: Construction work is physically demanding and involves long hours, tight deadlines, and high-stakes projects, all of which can lead to significant stress.
Job Security: 99% of European construction companies are SMEs or self-employed. The cyclic nature of construction work can create stress and uncertainty over finances, particularly for smaller businesses
Work-Life Balance: Construction workers often have irregular schedules, leading to difficulty maintaining a healthy work-life balance.
Safety Concerns: Construction sites are dangerous, and concerns about personal safety and the safety of co-workers contribute to anxiety and stress.
Substance Abuse: 15% of US construction workers have a substance abuse issue - almost twice the national average. This can significantly affect mental health.
The construction industry is high-stress, characterised by tight deadlines and potentially dangerous work environments. A historic stigma around discussing mental health is damaging - UK men in the construction industry are 3 times more likely to commit suicide than men on average.
What are the key factors causing poor mental health in construction?
The key factors causing poor mental health in construction are:
- Long working hours
- Heavy workloads
- Tight project deadlines
- Fear of redundancy
- Irregular working schedules
- Frequent travelling forcing separation from family and friends
- Isolated work environments
Between 2011-2015, a quarter of UK construction workers considered committing suicide - in the same period, over 1400 workers killed themselves. Stress is the most common mental health issue felt in construction - 97% of UK construction workers reported feeling stressed at work.
- 2 people working in construction in the UK die by suicide every working day.
- 1 in 3 construction workers suffer from elevated anxiety levels daily.
- Stress, anxiety and depression account for around 20% of work-related illnesses in construction - 400,000 workdays in the UK are lost annually due to these mental health issues.
- 83% of construction workers in the US have suffered from a moderate or severe mental health issue.
- The same study revealed that 90% of construction workers suffered some form of childhood trauma.
- 70% suffered from undiagnosed post-traumatic stress disorder.
UK Construction Statistics
What’s the outlook for UK construction in 2024?
The UK’s construction industry is predicted to experience a strong recovery in 2024 after a mixed year in 2023. Some reports suggest that the UK’s construction industry will grow 12% in 2024 and a further 3% in 2025.
Priorities for construction are likely to be focused on sustainability and efficiency, with the UK aiming to reach Net Zero by 2025.
How much is the construction industry worth in the UK?
The construction industry in the UK was worth £326.94 billion in 2022, with revenue forecasts for 2023 reaching £381.74 billion. The UK construction market is predicted to grow at a CAGR of 3.5% between 2023 and 2032.
How many new homes were built in 2022?
191,801 new homes were registered in the UK in 2022 - the highest number since 2007.
How many houses are there in the UK?
There were 29,584,210 homes in the UK in 2021.
The breakdown of the number of homes in the UK in 2021 was:
- England: 24.8 million
- Wales: 1.3 million
- Scotland: 2.67 million
- Northern Ireland: 814,210
How many homes need to be built in the UK?
The UK needs to build 4.3 million homes to meet today’s demands.
House building has dropped over the last few decades, from 2% growth per year between 1856–1939 to 1.2% growth annually between 1947-2019. Based on government targets of 300,000 new homes a year, clearing the backlog would take at least 50 years.
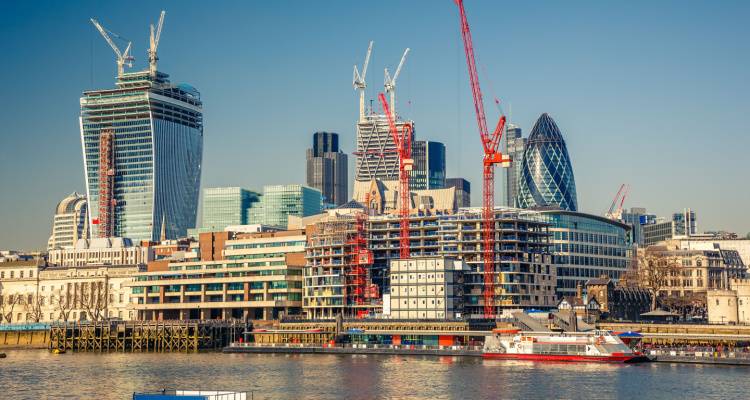
Which UK city has the most construction?
London has the most construction, with an output value of £42.57 billion in 2022. In contrast, the construction value output of Wales in 2022 was £6.8 billion.
How much of the UK is Green Belt?
Around 12.6% of the UK is green belt.
As of March 2022, around 12.6% of the UK’s land is designated as ‘Green Belt’. Between March 2021 and March 2022, the area of Green Belt land increased by 1.5%. This added 24,150 hectares to the estimated 1.64 million hectares of Green Belt land.
How much of the UK is urbanised?
Around 84% of the UK is urbanised.
‘Urbanisation’ indicates the movement of people from rural areas to urban areas. The higher the rate of urbanisation, the greater the shift in the population living in urban centres compared to rural areas.
As of 2021, the degree of urbanisation in the UK was 84.15%. The last decade has seen a steady increase in urbanisation - in 2011, the share of the population living in urban areas was 81.57%.
What percentage of the UK economy is construction?
Around 6% of the UK economy is construction.
Construction contributed £117 billion to the UK economy in 2018, which was 6% of the total that year. Construction economic output fell slightly from 2017 - the first fall since 2013.
What percentage of the UK is not built on?
Over 98% of the UK is not built on.
Estimates on the ‘built-on’ land in the UK differ, with estimates ranging from less than 1% to around 1.4%. This means over 98% of the UK land mass isn’t built on. Agriculture accounts for 57% of UK land mass, while 35% is deemed ‘natural’ or ‘semi-natural’.
The UK has become one of the world’s largest construction markets in recent years. Crossrail (costing $20 billion) is the largest infrastructure project in Europe. Other large-scale projects like HS2 and the Hinkley Point C nuclear power station provide thousands of jobs and transform local areas.
- The UK saw the highest number of new home registrations in 2022 (191,801) since 2007 (198,467).
- The value of all public sector construction work in 2021 was £31.687 billion.
- The value of all private sector construction work in 2021 was £83.892 billion.
- New orders for construction work rose 30.5% in 2021 to the highest level for over 45 years. The value of these orders reached £72.578 billion.
- Construction company insolvencies rose 25.7% YoY in 2021.
- The value of UK construction work output was £15.36 billion in May 2023 - this output decreased by 0.2% compared to April 2023.
- Overall construction output is estimated to increase by 1.5% annually between 2023-2027 - a downgrade on previous predictions of 3.2% between 2022-2026.
- At the start of 2022, construction output was 3% lower than in 2019.
- The public housing sector is expected to see a 4.4% contraction in 2023, with an annual growth rate of 1.1% - this means by 2027, public housing output may almost be below pre-Covid 2019 levels.
- Private housing starts are expected to fall by 25% in 2023, before recovering 2% in 2024.
- Builders’ merchants’ sales fell by 4.1% in Q2 2023 compared to the same period in 2022.
- However, sales were up 7.6% compared to Q1 2023.
- June sales were also up by 2.6% compared to June 2022.
- 55% of workers experienced delays due to skilled labour shortages.
- 73% of workers were delayed on jobs due to material shortages.
- Material cost increases meant 83% of builders had to pass those costs onto customers.
US Construction Statistics
How many homes have been built in the US?
There are around 152.2 million homes in the US. 10% of these were built in the first decade of the 21st century.
How many homes are built in the US each year?
Over 1.6 million homes were built in the US in 2022.
While the rate of housebuilding has decreased by 55% since 2006, population growth has also dropped by almost 50%. Pre-Recession, the ratio of population growth to house building was 2:1. This ratio increased to 5:1 from 2007 after construction collapsed.
However, the home construction rate has increased in recent years, and population growth has slowed. This means that the ratio of home construction to population growth is the closest it has been in nearly 20 years.
How much does construction contribute to US GDP?
Around 4%.
As of Q1 2023, construction contributes 4% to the total US GDP.
How big is the US construction industry?
Construction is one of the largest industries in the United States, contributing around 4% to the total GDP. Every year, almost $1.8 trillion worth of structures are built every year in the US.
The United States is expected to be the world’s second-largest construction market by 2030. Like many countries, the US suffered a slowdown in construction during Covid-19. The industry has since returned to normal output in most areas.
- Between 2016 and 2030, the US will spend an estimated $30 trillion on construction work.
- The construction industry in the US employs more than 7.8 million people.
- As of Q1 2023, construction accounts for 4% of US GDP.
- There are more than 753,000 employers in the construction industry in the US.
- 1.665 million houses were built in the US in 2022.
- New residential house sales for 2023 increased 4.4% in July. So far, the total new residential sales for 2023 is 714,000 (June 2023 estimated figures were 684,000).
- Privately-owned housing starts were at 1.452 million in July 2023. This was 3.9% above the June 2023 estimate of 1.398 million. As such, 54,000 new residential homes started construction in July.
- As of August 2023, homeownership rates in Q2 were 65.9% - not statistically different from Q2 2022.
Sole Proprietors

Among sole proprietors in various trade industries, the sector with the highest number is Plumbing/HVAC (43.22) with 4,735 sole proprietors, closely followed by Electrical installation (43.21) at 3,898 sole proprietors.
A sole proprietorship is an individual-owned, unincorporated business, where the owner pays personal income tax on any profits the business generates. It’s common for sole proprietors to operate under their own names. Below is a table of the types of sole proprietorships for the construction industry in the UK:
| Sole Proprietor Type | Number of proprietorships |
|---|---|
| Demolition | 26 |
| Site Preparation | 559 |
| Test Drilling/Boring | 20 |
| Electrical Installation | 3898 |
| Plumbing/HVAC | 4735 |
| Other Construction Installation and Finishing | 2953 |
| Plastering | 681 |
| Joinery | 4359 |
| Floor/Wall Covering | 1261 |
| Painting | 1379 |
| Glazing | 317 |
| Roofing | 1334 |
| Scaffolding | 645 |
| Other Specialised Construction | 2250 |
Construction Industry Waste Statistics

What waste is produced in the construction industry?
Typical waste produced in the construction industry includes brick, concrete, glass and wood.
While most construction waste can be recovered or downcycled into aggregate material (over 90% of construction waste in the UK is recovered), some waste must be disposed of in other ways - including materials like asbestos.
Around 50 billion tonnes of raw materials are extracted from the Earth every year to be used in built environments - but 13% of products sent to construction sites end up in landfill without being used.
- Over 100 billion tonnes of raw materials are consumed every year globally.
- Around half of those materials go into built environments.
- Construction is responsible for a third of all waste generated in the EU.
- The EU stated its aim to increase the recycling, re-use, and other material recovery of non-hazardous construction waste to at least 70% by 2020.
- 63% of the total waste produced by the UK in 2016 was attributed to construction, demolition and excavation - 120 million tonnes of waste.
- Over 90% of that waste was recovered, with common materials like asphalt, concrete, and brick downcycled for future use.
- 5 million tonnes of waste from construction, demolition and excavation was sent to landfill
- 32% of landfill waste in the UK is attributed to construction and demolition.
Demolition Industry Statistics
Why is demolition important to the construction industry?
Demolition is important to the construction industry as it forms a crucial part in the lifecycle of a building. For instance, commercial buildings typically have a lifespan of around 50-60 years, at which point they will need extensive repairs or renovations - or be demolished to make way for new developments.
What are the main reasons we demolish buildings?
The main reasons for demolition are:
- Clearing Space for New Structures: Re-developing land usually means demolishing existing structures.
- Urban Renewal and Development: Replacing old buildings with new, modern structures is key for serving the needs of communities in urban areas.
- Safety and Compliance: Older buildings may not meet current safety standards and contain dangerous materials (like asbestos). Economic Efficiency: It can be cheaper to demolish old structures rather than renovate.
- Adapting to Changing Needs: Demolition allows for the adaptation of physical spaces to changing community needs, whether it's for residential, commercial, or public use.
- Historical Preservation and Urban Planning: In some cases, demolition is necessary to preserve historical structures by removing adjacent buildings not of historical significance. This process aids in urban planning and the preservation of cultural heritage.
What are the main methods of demolition?
There are 3 main types of demolition:
1. Implosions: Also known as ‘controlled demolition’, this involves using explosives to knock out a building's primary supports. The structure then collapses inwardly. It is typically used for large structures like skyscrapers in urban areas.
2. Machine Demolition: This type of demolition uses heavy machinery to break buildings down. Contractors will use excavators, bulldozers, cranes, wrecking balls and other machinery to safely demolish the building.
3. Hand Demolition: The slowest and most labour-intensive type of demolition, this involves workers demolishing the building using hand tools. The main goal is usually to preserve parts of the building, such as for remodelling or historical preservation projects.
- The UK demolition market size was £1.1 billion in 2022.
- Implosions account for less than 1% of work in demolition.
- Commercial demolition costs an average of less than 2% of the replacement cost of the building.
- Between 90-97% of materials are recycled.
The Largest Demolition Contractors in the World
| Demolition Contractor | Country of Origin | Turnover ($ million)- 2020 |
|---|---|---|
| North Star | USA | $573 |
| Keltbray | UK | $360 |
| Brandenburg Industrial Services | USA | $271 |
| Erith Contractors | UK | $268 |
| Hagedorn Unternehmensgruppe | Germany | $167 |
| DH Griffin Wrecking | USA | $155 |
| McGee Group | UK | $153.9 |
| Penhall | USA | $150 |
| Freimuth Abbruch und Recycling | Germany | $145 |
| AF Gruppen | Norway | $132.4 |
Construction Industry Sustainability Statistics

How does sustainability affect construction?
Sustainability affects construction in a number of ways, altering practices, materials, designs and regulations.
The construction industry is one of the main contributors to global warming - cement production alone accounts for 8% of greenhouse gas emissions yearly. As such, changing materials has an impact on emissions. In-home construction, steel frames emit around 2.9 tons of CO2, whereas timber frames can store up to 7.5 tons of CO2.
Reducing waste is also crucial to sustainability in construction. Currently, 13% of materials sent to UK construction sites aren’t used, contributing to the 32% of landfill waste attributed to construction and demolition. Implementing more sustainable practices on construction sites will help reduce waste and ensure a greener industry.
Construction is an energy-intensive industry that consumes around half of the raw materials pulled out of the ground every year. Sustainability is a challenge but technology and new working methods are helping to combat emissions and waste.
- Construction accounts for around 36% of the world’s total energy demand.
- Concrete is the second most consumed material in the world - only water is consumed more.
- Cement production accounts for 8% of greenhouse gas emissions.
- Building and construction emitted 2% more CO2 emissions in 2021 than the pre-pandemic peak of 2019 - a total of 10 gigatonnes of CO2.
- In 2021, building and construction accounted for 34% of energy demand and 37% of energy and process-related CO2 emissions.
- The energy demand for lighting, heating, cooling and equipment in buildings increased by around 4% in 2021 compared to 2020.
- By 2032, the built environment could impact natural habitats and wildlife on 70% of the Earth’s land surface - mainly caused by increasing populations, economic activity and urbanisation.
- The US demolishes around 44,000 buildings and 270,000 homes every year - 90% of total construction and demolition debris generation is caused by demolition, with construction accounting for just 10%.
- Timber and wood manufacturing help cut carbon emissions - for every ton of dry timber manufactured, 1.8 tons of CO2 is removed from the atmosphere.
- Homes made with steel frames emit around 2.9 tons of CO2 - houses with timber frames can store up to 7.5 tons of CO2.
- Cement production releases 2.8 billion tons of CO2 into the atmosphere.
- Poor quality during construction can increase costs by up to 50% and the time taken to complete a building by 50%.
- Poor quality occurs in as much as 80% of building projects.
- Better quality management could save the UK construction industry up to £12 billion annually.
What are the Largest Construction Groups in the World?
| Group/Company | Country of Origin | Revenue ($ billion) | Market Cap ($ billions) |
|---|---|---|---|
| CSCEC (China State Construction Engineering) | China | 305.4 | 27.93 |
| CREC (China Railway Group) | China | 171.55 | 18.19 |
| CRCC (China Railway Construction Company) | China | 162.92 | 13.36 |
| CCCC (China Communications Construction Company) | China | 107.04 | 14.59 |
| MCC (Metallurgical Corporation of China) | China | 88.08 | 8.15 |
| Power Construction Corp. of China | China | 85.1 | 11.17 |
| Vinci | France | 64.97 | 71.37 |
| China Energy Engineering Corp. | China | 54.45 | 10.6 |
| Bouygues | France | 46.69 | 14.48 |
| SCG (Shanghai Construction Group) | China | 42.51 | 3.12 |
| Daiwa House Industry Co. | Japan | 39.52 | 19.60 |
| Grupo ACS | Spain | 35.41 | 10.52 |
| Lennar | US | 33.67 | 38.17 |
| DR Horton | US | 33.48 | 44.81 |
| Samsung C&T Corp. | South Korea | 33.41 | 17.07 |
| Sekisui House | Japan | 26.46 | 13.79 |
| Eiffage | France | 21.98 | 9.96 |
| L&T (Larsen & Toubro Ltd.) | India | 21.31 | 55.97 |
| SRBG (Sichuan Road and Bridge Group) | China | 20.09 | 9.42 |
| Kajima Group | Japan | 18.51 | 7.93 |
| Strabag | Austria | 17.94 | 4.21 |
| Obayashi | Japan | 17.12 | 6.13 |
| HDEC (Hyundai Engineering & Construction Co. Ltd.) | South Korea | 16.44 | 3.15 |
| PulteGroup | US | 16.23 | 20.11 |
| Skanska AB | Sweden | 16.13 | 6.78 |
| Jacobs Engineering | US | 14.92 | 16.23 |
| Daito Trust Construction | Japan | 14.09 | 7.69 |
| Taisei Corp. | Japan | 13.74 | 6.51 |
| Flour Corp. | US | 13.74 | 6.48 |
| Shimizu Corp | Japan | 13.2 | 4.94 |
New Home Developments
New Developments in the UK
- England has built an average of around 178,000 new dwellings annually over the last decade - far below the government’s target of 300,000 per year.
- In the 1970s, an average of 250,000 new homes were built each year.
- Over the last 3 years, 95 of the 315 UK local planning authorities (LPAs) have failed to reach their 95% delivery target.
- 75% of LPAs are at risk of having out of date plans for housing delivery by the end of 2025.
- 67% of local plans are currently out of date.
- 38% of LPAs will have housing plans that more than 10 years old by the end of 2025.
- Homes England delivered a number of housing programmes between 1st April and 30th September 2023 - this resulted in 11,297 completed homes during the period. 11,530 homes were started.
- A higher percentage of starts were affordable when compared to the same period last year - 86% vs. 74%.
- 7831 of the homes built during the period were affordable, in line with the 7905 completed in the same period the previous year.
- The public sector built 35,570 homes in 2022-23 - the highest number since the 1980s.
- The Affordable Homes Programme 2021-2026 aims to deliver approximately 162,000 affordable homes across England over the next few years. Most projects are expected to complete by 2028.
- 50% of the supplied properties will be for owner occupation (with most being shared ownership).
- 50% of the supplied properties will be rental tenures (most with a new right to shared ownership attached).
- As of May 2022, around 70% of the £11.5 billion in funding has already been allocated.
New Home Developments in Europe
- As of 2022, the European countries building the most new homes per 1000 residents are:
- Austria - 6.47
- Liechtenstein - 5.81
- Serbia - 5.66
- France - 5.53
- Norway - 5.44
- Poland - 5.3
- Ireland - 5.26
- Luxemburg - 4.98
- Croatia - 4.93
- Bulgaria - 4.7
New Home Developments in the US
- Austin-Round-Rock-Georgetown in Texas was the metro area (with a population of more than 1 million people) building the highest number of new homes in 2022, with 42.5 homes authorised for every 1000 existing homes. The metro areas building the most homes in 2022 were (measured as per 1000 existing homes):
- Austin-Round-Rock-Georgetown (Texas) - 42.5
- Raliegh-Cary (North Carolina) - 36.2
- Nashville-Davidson-Murfreesboro-Franklin (Tennessee) - 32.8
- Jacksonville (Florida) - 32.6
- Houston-The-Woodlands-Sugar Land (Texas) - 26.8
- The states building the most homes in 2022 (per 1000 existing homes) were:
- Utah - 26.7
- Idaho - 24.2
- South Dakota - 23.5
- Texas - 22.2
- Florida - 21.1
- Arizona - 19.4
- Colorado - 19.2
- North Carolina - 19.1
- South Carolina - 19.1
- Georgia - 17.3
- Alaska - 1.8
- Rhode Island - 2.8
- Connecticut - 3.7
- Illinois - 3.8
- West Virginia - 4.0
- Michigan - 4.8
- Pennsylvania - 5.9
- New York - 4.9
- Mississippi - 5.7
- Massachusetts - 5.9
New Home Developments in Asia
- The Asian real estate market is expected to reach a value of $292.10 trillion in 2024.
- Between 2024-2028, the Asian real estate market is predicted to grow at a CAGR of 2.92%, reaching $327.80 trillion by 2028.
- China is expected to generate the highest value in the global real estate market in 2024, with $135.70 trillion.
- The Asia-Pacific region held over 43% of the global real estate market share in 2022.
Sources
Oxford Economics, United Nations Environment Programme, International Energy Agency, National House Building Council, World Bank, Statista, Architecture and Design, One Nine Elms, Office for National Statistics, National Records of Scotland, UK government, Centre for Cities, B1M, World Green Building Council, The Associated General Contractors of America, US Bureau of Economic Analysis, USA Facts, US Census Bureau, US Department of Housing and Urban Development, Health and Safety Executive, International Labour Organization, European Agency for Safety and Health at Work, The Chartered Institute of Building, Mates In Mind, Construction Industry Training Board, Statistics Canada, Lien Centre for Social Innovation, American Addiction Centers, Construction Industry Rehabilitation Plan, Science Museum, Circle Economy, BBC, EU, Construction Leadership Council, Department for Environment, Food and Rural Affairs, Designing Buildings, City Changers, Engineering Failure Analysis, US Environmental Protection Agency, 8billiontrees, Deloitte, Frontiers in Engineering and Built Environment, Construction Skills Network, Construction Industrial Training Board, AGC, Centre for Construction Research and Training, Construction Products Association, Builders Merchant Building Index, Action on Empty Homes, World Population Review, Shelter, Trase, The Business Research Company, MAC, Portland Cement Association, Meteor Electrical, CDC, CPWR, ArchDesk, IBIS World, Demolition & Recycling International, Federation of Master Builders, Glenigan, Litchfields, BCIS, Construction Coverage
Last updated by MyJobQuote on 2nd February 2024.